
USD on the waves of Dow Jones: vicious ties of the American financial market. Outlook for USD for the current week.
Good day to everyone for whom the week begins with a review of the news, as well as to those,
for whom the world is simply not interesting without trade. With you the researcher of labyrinths and anomalies of exchange trade Andrew Green.
We start our trading week, probably with the most important part in the analysis of trading instruments of the international currency market ForEx – from the analysis of the overall dynamics of the US dollar on the example of the DXY index.
Last week gave us an interesting round in the development of events around the USD. What was the reason for this movement, with a fairly light load on the economic calendar of key events in the ForEx market? Here I once again remind that the financial market is not a simple mechanism with a large number of participants and factors that have mutual influence on each other. Therefore, I recommend that you look closely at the overall dynamics of the US stock market.
To do this, we use a composite activity indicator – the Dow Jones Industrial Index.
The Dow Jones Industrial Average (DJA, NYSE: DJI) is one of several stock indices created by the Wall Street Journal editor and founder of Dow Jones & Company, Charles Dow.
The index covers the 30 largest US companies. The definition of “industrial” is nothing more than a tribute to history: now many of these companies do not belong to this industry.
(WIKIPEDIA)
If we do not go into a deep analysis of the so-called intermarket correlations, then the movement of the stock index is directly opposite to the movement of the currency index, of course, in the absence of the influence of other factors on the market.
As we see on the chart (Figure # 1), after a steady growth throughout the last year, almost to the level of 26600.00, this financial instrument together with the entire stock market of the USA showed a dynamics of more than 10% for the decline.
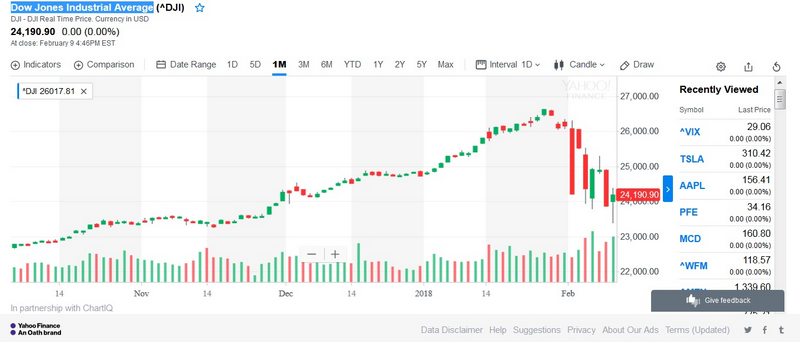
What was the reason for this movement and what to expect in the future?
Basically, all this hype is attributed to the influence of four factors:
1.increase in inflation risks. The probability of a more rapid increase in inflation to key levels of the Federal Reserve in the amount of 2% has increased, so many market participants expect further acceleration in raising the discount rate for federal funds;
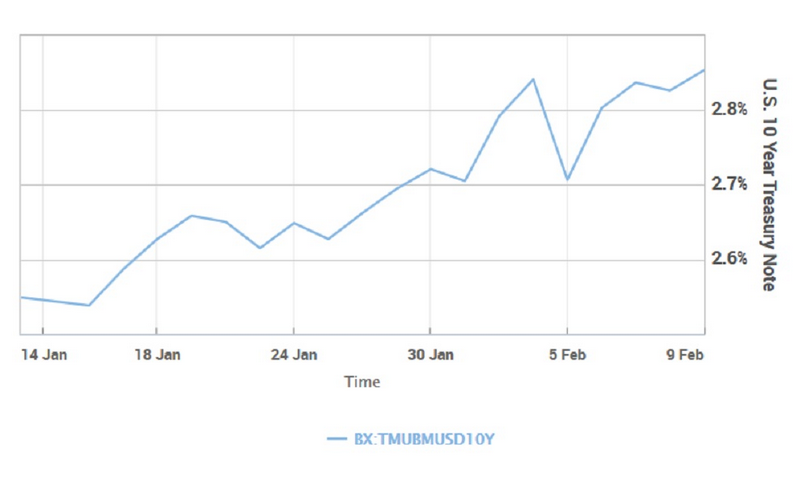
2.growth rates and sales in the US government bonds market, for a week about 3% (Figure # 2). This is a consequence of the revision of the prospects for a further increase in the Federal Reserve rate;
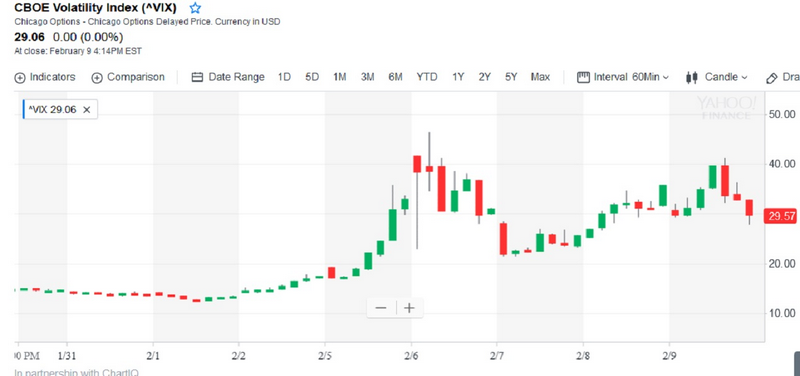
3.increase in the volatility of the stock market. The index of activity in the US stock market, so called VIX, showed changes of -13.15% only for the last Friday (09.02.2018) (Figure # 3). Such a movement in the market for a cautious investor and most investors is an indicator that it’s time to take money and flow to another exchange site);
4.algorithmic trade. And this is generally a problem of the modern financial market almost number 1.Nowadays, the developed trade with the help of trade advisors and other programming products and modern technologies, makes the situation with the accelerated reaction of such “traders” to sharp market breakdowns very dangerous. Programs perceive them as orders to action. As a result, a false breakdown, or the effect of a “thick” finger, can cause an avalanche reaction of algorithmic traders.
In general – everything is clear, but the question is, what’s next? To be honest, it is difficult to say, we will look as events unfold. And I have experience of such movements in the market. In such cases, my source of information for trading is one – technical analysis and risk control in conservative Money Management. If for you all the information mentioned above is unclear, have a closer look at individual training courses. You can find out more about the courses on the website of the partner company Ester, and also sign up for course.
[maxbutton id=”2″ url=”https://esterholdings.com/learning/paid-training/modul-basic/#modal-1″ text=”Sign up for a course now!” ]
We proceed to the trade itself. To do this, we use the DXY tool and its graph on H4 (Figure # 4). We observe two zones. Blue – for sales, red – for purchases.
As we see, everything is quite clear.
We buy from the lows of last week and January 2018, we sell from the resistance line of the downward dynamics of the DXY itself.
Examples of transactions:
- SELL limit 92.30, SL 92.80, TP 91.70
- BUY limit 91.75, SL 91.40, TP1 92.20 (½ volume) TP2 92.90 (½ volume) – development of the double bottom.
As for me, the most possible of these two options this week is a reversal for purchase with further development of the double bottom.
Trade is a pleasure. There is no place for emotional impulses in decision-making, but there is joy from the result.
Andrew Green