
U.S. GDP data
- GDP (q/q) (Q3), fact 3.5%, forecast 3.6%.
- GDP deflator (q/q) (Q3), fact 1.4%, forecast 1.4%.
- Goods trade balance (October), the fact -77,25B, the forecast -76,70B.
Preliminary data on the US GDP were worse than market expectations and coincided with the value of October, thus indicating a slowdown in the growth of this indicator.
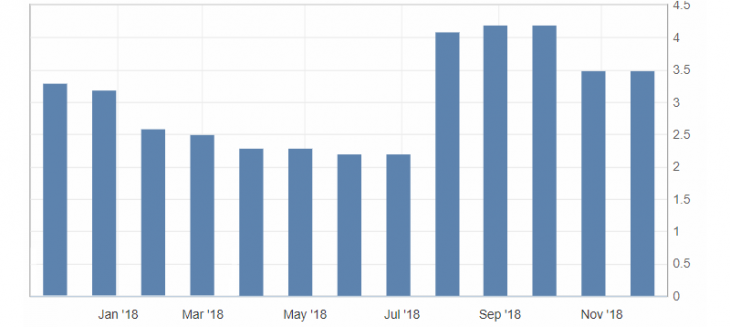
Fig. 1. U.S. GDP chart (q/q) (Q3)
Growth in the budget deficit updated the high from the middle of 2015 was also negative news in the USA. Despite the negative data on the USA, the market did not react to the published statistics, having completely switched to the upcoming speech of US Federal Reserve Chairman Powell.
The US dollar index continues to be limited by the sideways trend. Support levels: 97.20-30 and 97.00, resistances: 97.50 and 97.70.
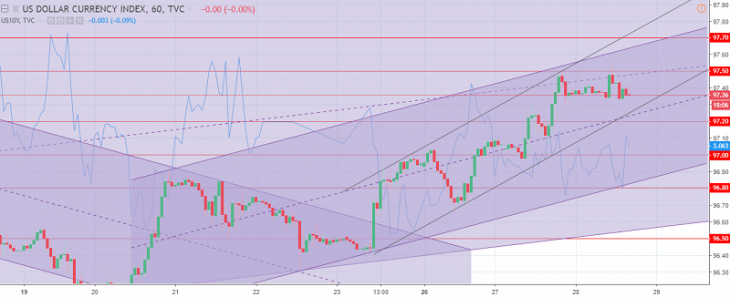
Fig. 2. The US dollar index chart. The current price is 97.40 (10-year government bonds yield is the blue line)
Read also: “EBB 1 Trading Strategy – Envelopes and Bollinger Bands”
Hanzenko Anton
Earn with the help of the trade service on the news Erste News!
Topical articles of the trader’s blog:
- Expectations from the NZD/USD pair at year’s end!
- An engulfing strategy. A Trend reversal.
- Gold is limited to annual correction! What to expect?!
Current Investment ideas: