
US GDP data
- US GDP (q / q), fact 2.0%, forecast 2.2%.
- The US GDP deflator (q / q), fact 2.2%, forecast 1.9%
- The number of initial applications for unemployment benefits in the US, fact 227K, forecast 220K.
US GDP growth rates continue to slow for the seventh consecutive month, beginning in December 2017.
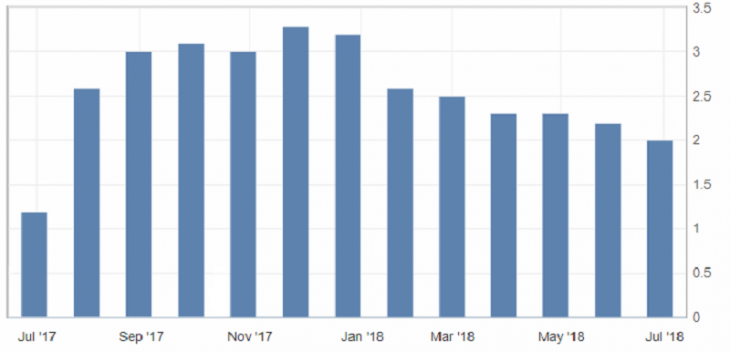
Fig. 1. US GDP Chart
An additional negative factor in the US report was the growth in the number of applications for unemployment benefits, which slightly increased, but remains near historical lows.
The US dollar index almost didn’t react to the weak data on the US. But the assets of the safe harbor strengthened against the American dollar. Weak statistics on the US can act as a driver of correction for US currency at the opening of the American session.
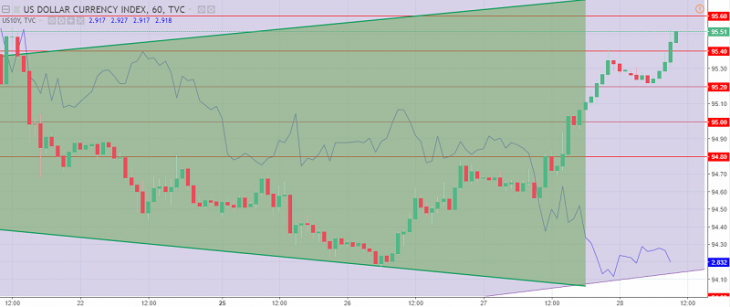
US dollar index Graph. The current price is 94.70 (the yield of 10-year government bonds is a blue line)
Read also: “The US Stock Market and its Main Exchange Indices”
Hanzenko Anton