
U.S. data
- Shipments of nondefense capital goods (excluding aircraft) (m/m), fact -4.4%, previous value -0.1%.
- Core durable goods orders (m/m) (oct), fact 0.1%, forecast 0.4%.
- Durable goods orders (m/m) (October), fact -4,4%, forecast -2,2%.
- Initial jobless claims, fact 224K, forecast 215K.
U.S. data was negative on the full range. Fears have caused data on the number of initial jobless claims, which have been growing since September of this year. The main pressure on the US currency had data on durable goods orders in the US, which declined in October in all key parameters.
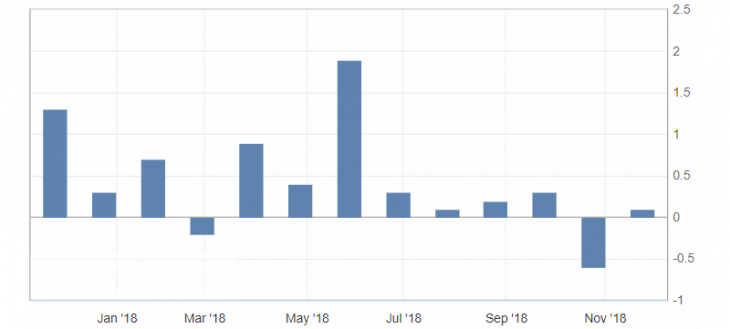
Fig. 1. U.S. durable goods orders chart
The US dollar index accelerated the decline in the publication of weak US data and the growth of optimism in the stock markets, which confirmed keeping of the downward dynamics of the American dollar and opened the way to support levels: 96.50 and 96.30-20.
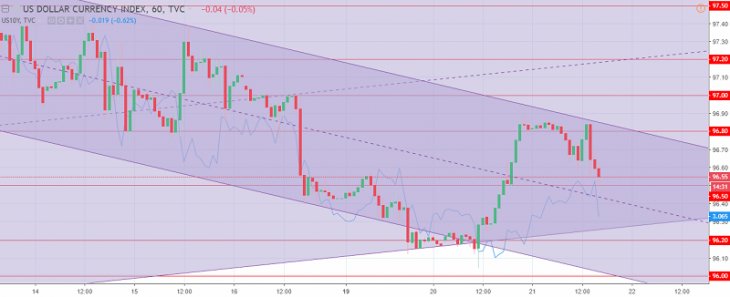
Fig. 2.The US dollar index chart. The current price is 96.50 (10-year government bonds yield is the blue line)
Read also: “In Focus: A Profitable Deal in May!” Let’s analyze “
Hanzenko Anton
Earn with the help of the trade service on the news Erste News!
Topical articles of the trader’s blog:
- Gold is limited to annual correction! What to expect?!
- The Australian dollar (AUD) is in anticipation of the annual correction! What to expect?!
- Dow Theory – Averages must confirm each other!
Current Investment ideas:
- “3 reasons to buy Cisco Systems Inc. shares”
- “It’s time to hit the jackpot on the sale of McDonalds shares!”