
U.S. retail sales data
- Core Retail Sales (m/m) (Oct), fact 0.7%, forecast 0.5%.
- Export Price Index (m/m) (Oct), fact 0.4%, forecast 0.1%.
- Import Price Index (m/m) (Oct), fact 0.5%, forecast 0.1%.
- Initial jobless claims, fact 216K, forecast 216K.
- NY Empire State manufacturing activity index (November), fact 23.30, forecast 19.30.
- Philadelphia Fed Manufacturing Index (November), fact 12.9, forecast 20.7.
- Retail sales (m/m) (October), fact 0.8%, forecast 0.6%.
Published block of statistics on the United States was very positive despite the decline in manufacturing activity in the United States. Of particular note is the retail sales data, which show a significant increase in the main indicators (monthly index and the volume of retail sales). The data rapidly increased in October and confirmed market expectations regarding the possibility of raising rates in the United States.
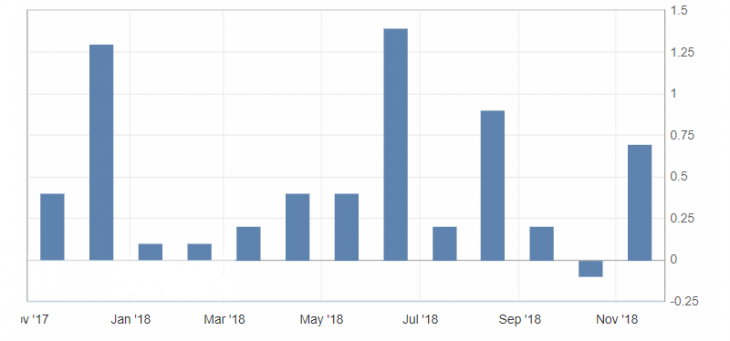
Fig. 1. U.S. Core retail sales index chart (m/m)
Positive statistics contribute to the growth of the dollar index against a basket of major competitors, but at the same time, the US dollar index continues to be limited by risks per pound and uncertainty in the market. As a result, the rising dynamics of the US dollar index remains limited by resistance levels: 97.30 and 97.50. Significant support is the marks: 97.00 and 96.80.
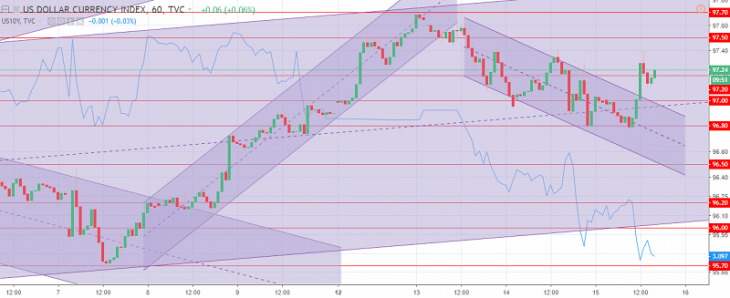
Fig. 2. The US dollar index chart. The current price is 97.20 (10-year state bonds yield is the blue line)
Read also: “The Euro index as an auxiliary indicator”
Hanzenko Anton
Earn with the help of the trade service on the news Erste News!
Topical articles of the trader’s blog:
- The Australian dollar (AUD) is in anticipation of the annual correction! What to expect?!
- Dow Theory – Averages must confirm each other!
- Market activity depending on the days of the week
Current Investment ideas: