
U.S. Real estate data
- Building permits (m/m) (October), fact -0.6%, forecast -0.8%.
- Building permits (Oct), fact 1,263M, forecast 1,260M.
- Housing starts (m/m) (October), fact of 1.5%, forecast of 1.6%.
- Housing starts (Oct), fact 1,228M, forecast 1,225M.
The report on the primary real estate market in the US in October was very positive. Despite the decline in the new-home constructions, which corresponds to the statistical error of this indicator, the number of building permits issued has increased over the past three months, indicating a slowdown in the downward trend. As a result, this report can be regarded as very positive and providing support for the American currency.
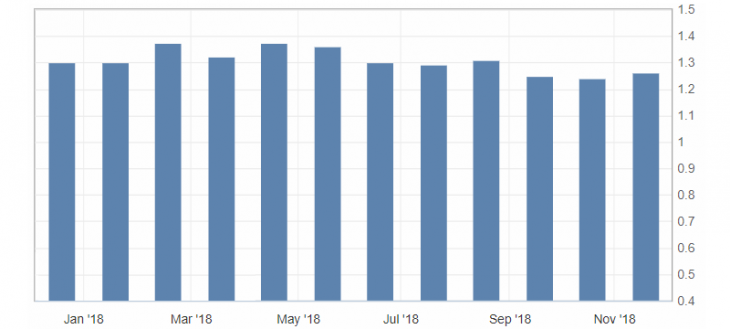
Fig. 1. Graph of the number of building permits issued in the USA
The US dollar index received support from this report, and the growth of negative sentiment in the stock market increased the demand for the American. As a result, the US dollar index moved to a correction after a decline, which could eventually lead to the test of resistance levels: 96.50 and 96.60.
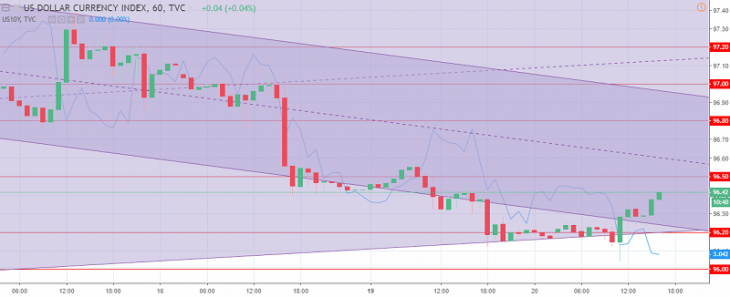
The US dollar index chart. The current price is 96.40 (10-year government bonds yield is the blue line)
Read also: “Japanese yen (JPY) – Features of trading on crosses”
Hanzenko Anton
Earn with the help of the trade service on the news Erste News!
Topical articles of the trader’s blog:
- Gold is limited to annual correction! What to expect?!
- The Australian dollar (AUD) is in anticipation of the annual correction! What to expect?!
- Dow Theory – Averages must confirm each other!
Current Investment ideas: