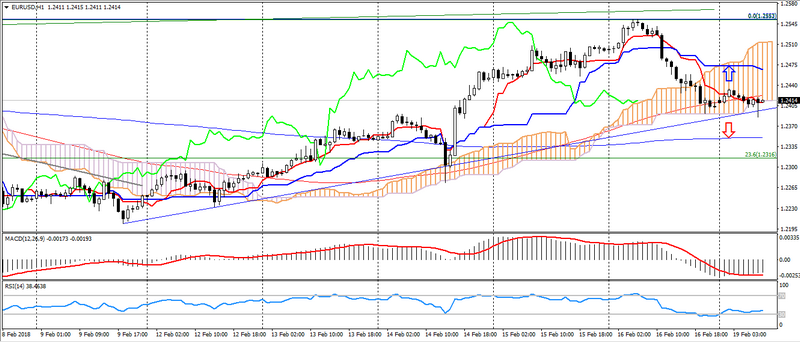
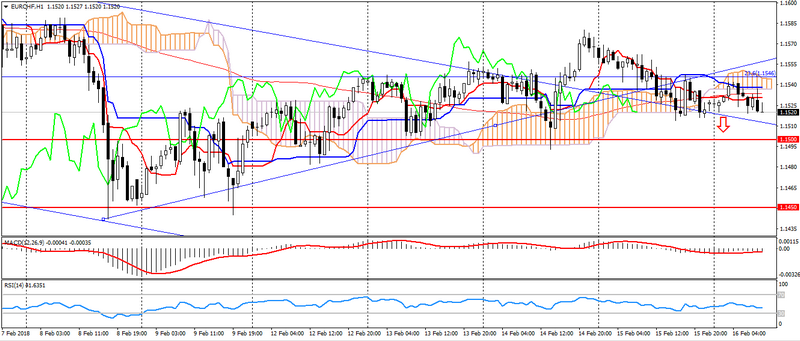
EUR USD (current price: 1.2530)
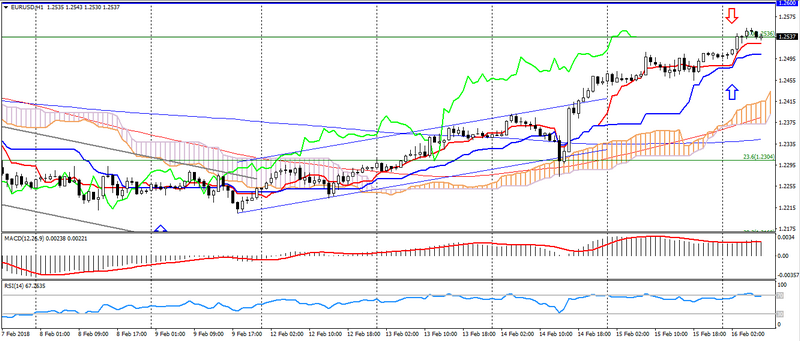
- Support levels: 1.2100 (September 2017 maximum), 1.1900, 1.1700.
- Resistance levels: 1.2600, 1.2750 (March 2013 minimum), 1.2270 (November 2014 minimum).
- Computer analysis: MACD (12,26,9) (signal-upward movement): the indicator is above 0, the signal line is in the body of the histogram. RSI (14) is in the overbought zone. IchimokuKinkoHyo (9,26,52) (signal – upward movement): the Tenkan-sen line is above the Kijun-sen line, the price is higher than the cloud.
- The main recommendation: sale entry is started from 1.2550, 1.2580, 1.2600.
- Alternative recommendation: buy entry is started from 1.2500, 1.2460, 1.2430.
The euro accelerated the growth at the beginning of the day on the weakness of the American, as a result of which a multi-year high was renewed. At the same time, the Forex indicator (MACD on D1) keeps a bearish divergence, which can cause correction.
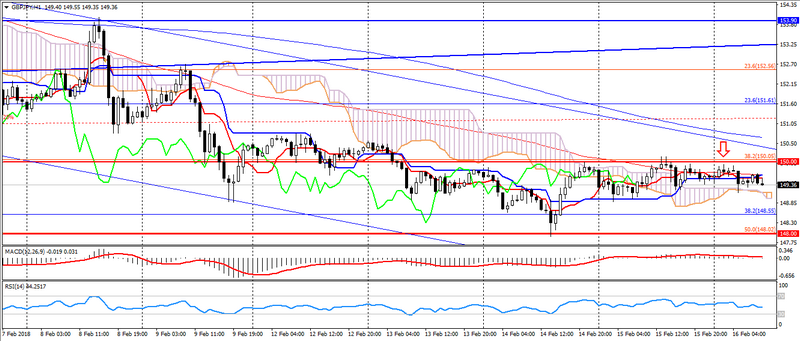
GBP USD (current price: 1.4120)
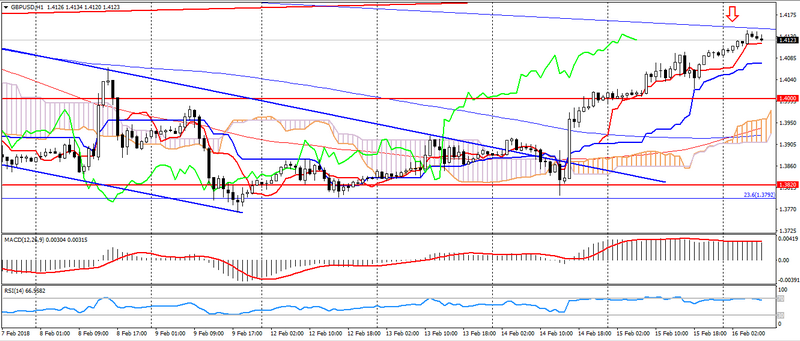
- Support levels: 1.4000 (April 2016 minimum), 1.3820, 1.3650 (September 2017 maximum).
- Resistance levels: 1.4350, 1.4500, 1.4750 (May May 2016 maximum).
- Computer analysis: MACD (12,26,9) (signal – upward movement): the indicator is above 0, the signal line is in the body of the histogram. RSI (14) is in the overbought zone. IchimokuKinkoHyo (9,26,52) (signal – upward movement): the Tenkan-sen line is above the Kijun-sen line, the price is higher than the cloud.
- The main recommendation: sale entry is started from 1.4150, 1.4180, 1.4200.
- Alternative recommendation: buy entry is started from 1.4090, 1.4040, 1.4000.
The British pound also strengthened on the weakness of the American, but is limited to the highs of January, as indicated by the Forex indicators, or rather the bearish divergence.
USD CHF (current price: 0.9200)
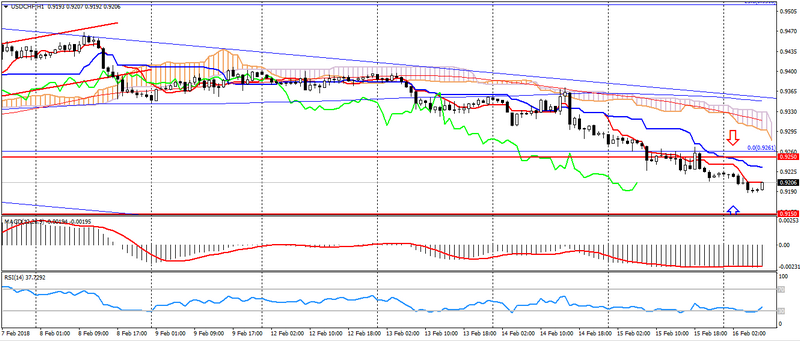
- Support levels: 0.9250 (August 2015 minimum), 0.9150, 0.9050 (May 2015 minimum).
- Resistance levels:, 0.9550, 0.9800, 1.0030 (November 2017 maximum).
- Computer analysis: MACD (12,26,9) (signal – downward movement): the indicator is below 0, the signal line is in the body of the histogram. RSI (14) is in the oversold zone. IchimokuKinkoHyo (9,26,52) (signal – downward movement): the Tenkan-sen line is below the Kijun-sen line, the price is below the cloud.
- The main recommendation: sale entry is started from 0.9220, 0.9250, 0.9280.
- Alternative recommendation: buy entry is started from 0.9180, 0.9150, 0.9130.
The Swiss franc also maintains a positive dynamic on the weakness of the American, limiting itself to a significant overbought.
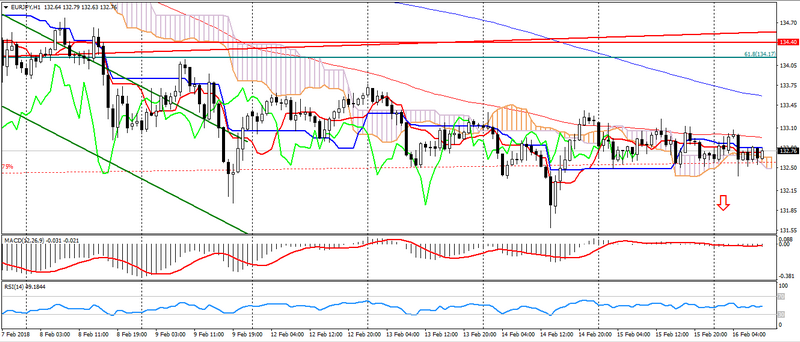
USD JPY (current price: 106.00)
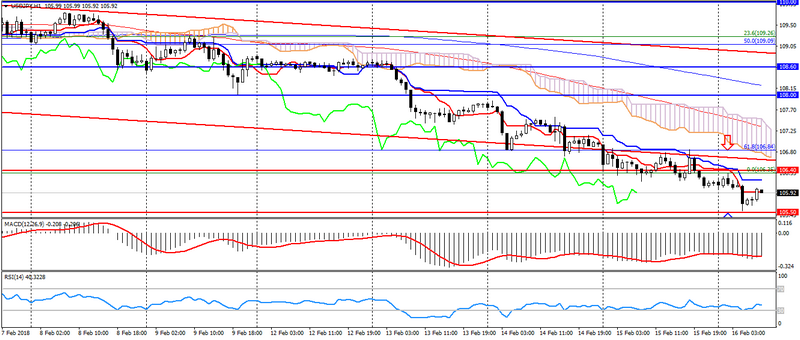
- Support levels: 106.40, 105.50, 104.50.
- Levels of resistance: 108.00, 108.60, 110.00.
- Computer analysis: MACD (12, 26, 9) (signal – downward movement): the indicator is below 0, the signal line is in the histogram. RSI (14) is in the neutral zone. IchimokuKinkoHyo (9,26,52) (signal- upward movement): the Tenkan-sen line is below the Kijun-sen line, the price is below the cloud.
- The main recommendation: sale entry is started from 106.40, 106.70, 107.90.
- Alternative recommendation: buy entry is started from 105.80, 105.50, 105.30.
The Japanese yen keeps growing on positive data on Japan and American sales, remaining in the oversold zone.
USD CAD (current price: 1.2460)
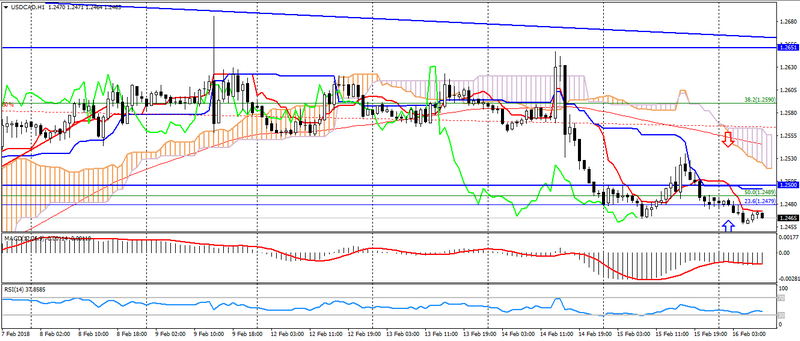
- Support levels: 1.2340.1.2200, 1.2060 (2017 minimum).
- Resistance levels: 1.2500, 1.2650, 1.2770 (August 2017 maximum).
- Computer analysis: MACD (12, 26, 9) (signal – downward movement): the indicator is below 0, the signal line is in the body of the histogram. RSI (14) is in the overbought zone. IchimokuKinkoHyo (9,26,52) (signal – downward movement): the Tenkan-sen line is below the Kijun-sen line, the price is below the cloud.
- The main recommendation: sale entry is started from 1.2480, 1.2500, 1.2530.
- Alternative recommendation: buy entry is started from 1.2450, 1.2430, 1.2400.
The Canadian dollar accelerated growth on the decline of the US dollar, thereby resuming a downtrend in the pair. At the same time, the Forex MACD indicator also indicates the formation of divergence pests, which can slow down further decline.
AUD USD (current price: 0.7980)
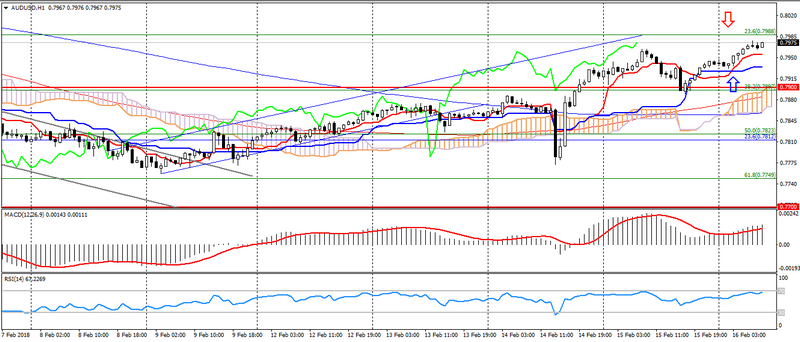
- Support levels: 0.7900, 0.7700 (March 2017 maximum), 0.7500.
- Resistance levels: 0.8120 (2017 maximum), 0.8200, 0.8290 (2014 maximum).
- Computer analysis: MACD (12, 26, 9) (signal – upward movement): the indicator is above 0, the signal line is in the body of the histogram. RSI (14) is in the overbought zone. IchimokuKinkoHyo (9,26,52) (signal – upward movement): the Tenkan-sen line is above the Kijun-sen line, the price is higher than the cloud.
- The main recommendation: sale entry is started from 0.7990, 0.8020, 0.8040.
- Alternative recommendation: buy entry is started from 0.7930, 0.7900, 0.7880.
The Australian also strengthened at the beginning of the day on the positive dynamics of the raw materials and weakness of the American.
NZD USD (current price: 0.7420)
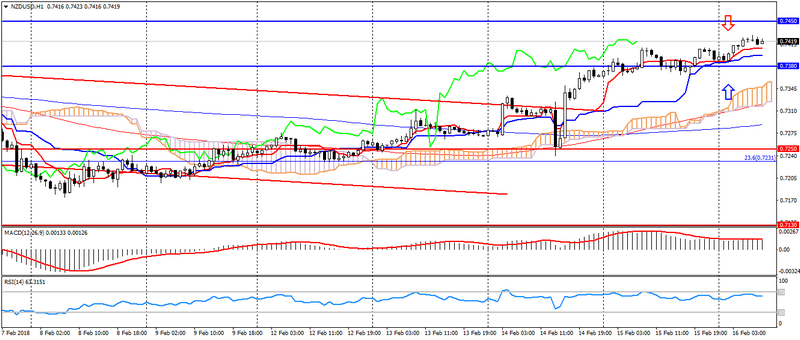
- Support levels: 0.7250, 0.7130 (August 2017 minimum), 0.7000.
- Resistance levels: 0.7380, 0.7450, 0.7550 (2017 maximum).
- Computer analysis: MACD (12, 26, 9) (signal-upward movement): the indicator is above 0, the signal line is in the body of the histogram. RSI (14) is in the zone of easy overbought. IchimokuKinkoHyo (9,26,52) (signal – upward movement): the Tenkan-sen line is above the Kijun-sen line, the price is higher than the cloud.
- The main recommendation: sale entry is started from 0.7430, 0.7450, 0.7480.
- Alternative recommendation: buy entry is started from 0.7380, 0.7350, 0.7330.
The New Zealand dollar updated January’s maximum on the weakness of the American, but, like most couples, is limited to overbought.
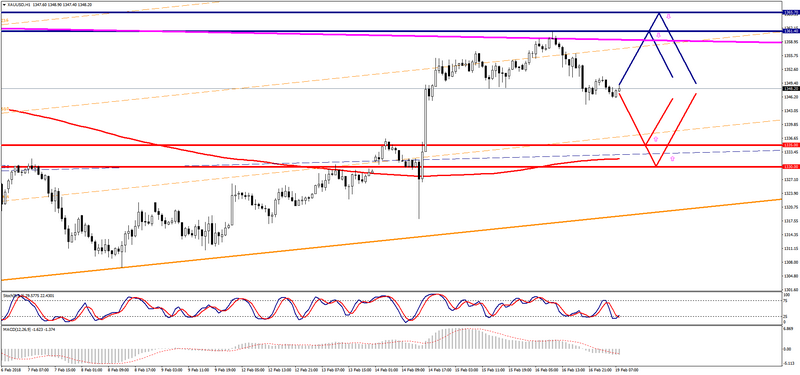
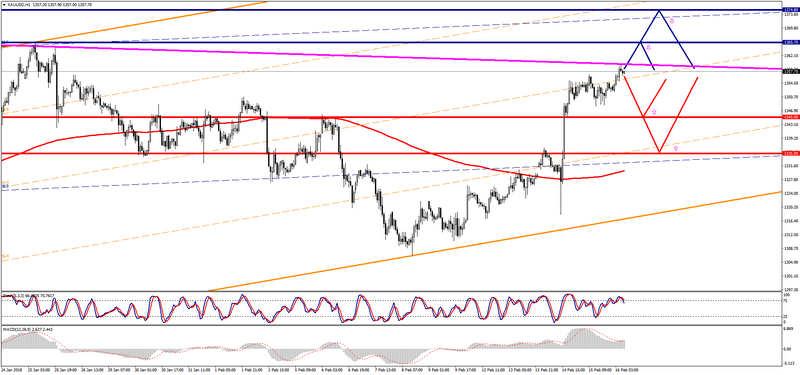
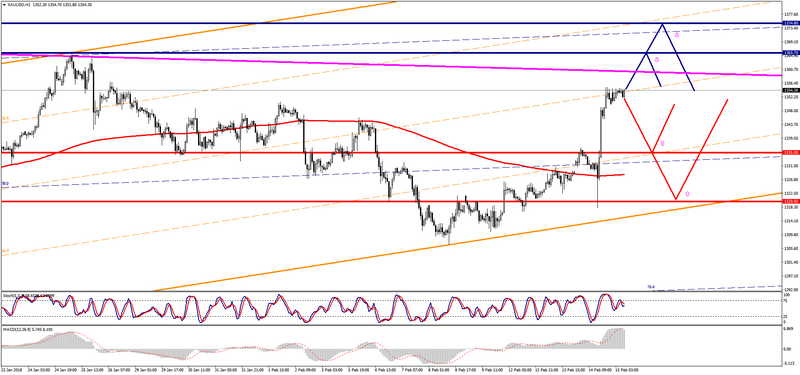
XAU USD (current price: 1358.00)
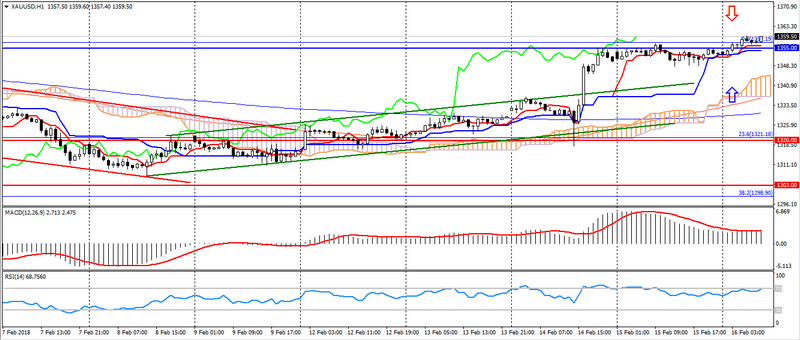
- Support levels: 1320.00, 1303.00, 1280.00.
- Resistance levels: 1355.00 (May May 2016 maximum), 1374.00, 1290.00 (March 2016 maximum).
- Computer analysis: MACD (12, 26, 9) (signal – upward movement): the indicator is above 0, the signal line is in the body of the histogram. RSI (14) is in the overbought zone. IchimokuKinkoHyo (9,26,52) (signal- upward movement): the Tenkan-sen line is above the Kijun-sen line, the price is higher than the cloud.
- The main recommendation: sale entry is started from 1361.00, 1365.00, 1370.00.
- Alternative recommendation: buy entry is started from 1355.00, 1347.00, 1343.00.
Gold also accelerated growth on the weakness of the American, but is limited to the highs of January.