技术分析

Technical analysis of cross-rates. (Anton Hanzenko)

EUR GBP (current price: 0.8770)

  • Support levels: 0.8730 (minimum of the last months), 0.8650, 0.8530.
  • Resistance levels: 0.8810, 0.8900, 0.9050 (November 2016 maximum).
  • Computer analysis: MACD (12, 26, 9) (signal – downward movement): the indicator is below 0, the signal line is in the body of the histogram. RSI (14) is in the neutral zone. Ichimoku Kinko Hyo (9, 26, 52) (signal – flat): the Tenkan-sen line is below the Kijun-sen line, the price is in the cloud.

Тechnical analysis of currency pairs (Anton Hanzenko)

EUR USD (current price: 1.2060)

  • Support levels: 1.2100 (September 2017 maximum), 1.1900, 1.1700.
  • Resistance levels: 1.2600, 1.2750 (March 2013 minimum), 1.2270 (November 2014 minimum).
  • Computer analysis: MACD (12, 26, 9) (signal – downward movement): the indicator is below 0, the signal line is in the body of the histogram. RSI (14) is in the slight oversold zone. Ichimoku Kinko Hyo (9, 26, 52) (signal – downward movement): the Tenkan-sen line is below the Kijun-sen line, the price is below the cloud.

Technical analysis of cross-rates. (Anton Hanzenko)

EUR GBP (current price: 0.8810)

  • Support levels: 0.8730 (minimum of the last months), 0.8650, 0.8530.
  • Resistance levels: 0.8810, 0.8900, 0.9050 (November 2016 maximum).
  • Computer analysis: MACD (12, 26, 9) (signal – downward movement): the indicator is above 0, the signal line has left the body of the histogram. RSI (14) is in the overbought zone. Ichimoku Kinko Hyo (9, 26, 52) (signal – upward movement): the Tenkan-sen line is above the Kijun-sen line, higher into the clouds.

Тechnical analysis of currency pairs (Anton Hanzenko)

EUR USD (current price: 1.2110)

  • Support levels: 1.2100 (September 2017 maximum), 1.1900, 1.1700.
  • Resistance levels: 1.2600, 1.2750 (March 2013 minimum), 1.2270 (November 2014 minimum).
  • Computer analysis: MACD (12, 26, 9) (signal – upward movement): the indicator is above 0, the signal line is in the body of the histogram. RSI (14) is in the neutral zone. Ichimoku Kinko Hyo (9, 26, 52) (signal – downward movement): the Tenkan-sen line is above the Kijun-sen line, the price is below the cloud.

Technical Analysis of Oil (Alexander Sivtsov)

Oil is trading below the zero mark in the Asian session.

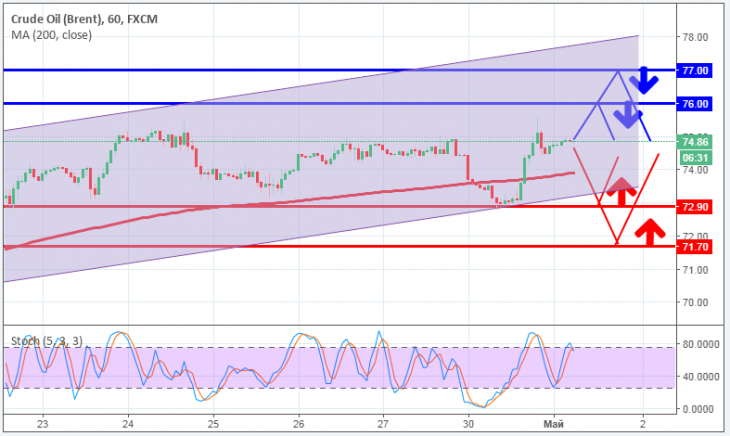
Brent chart (current price: $ 73.52)

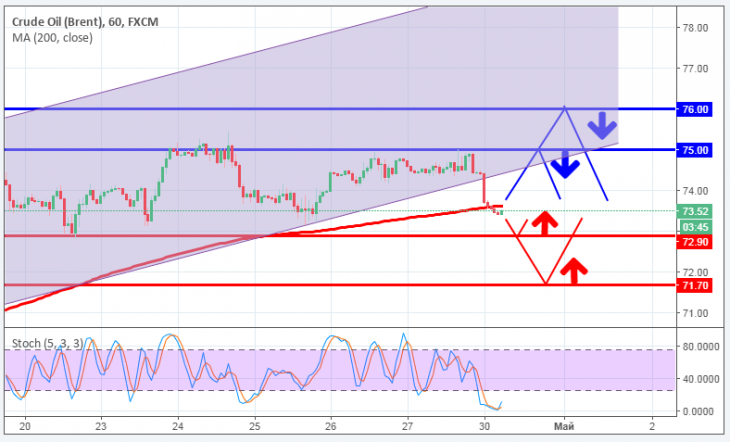
The Brent is trading below the zero mark during the Asian session.

  • Resistance 1: From $ 75.00 (psychological level)
  • Resistance 2: From $ 76.00 (psychological level)
  • Support 1: From $ 72.90 (technical level)
  • Support 2: From $ 71.70 (technical level)

Computer analysis: The Stochastic Oscillator movings on the H1 chart indicate the oversold of the instrument, against which the Brent price may recover.


WTI chart (current price: $ 67.86)

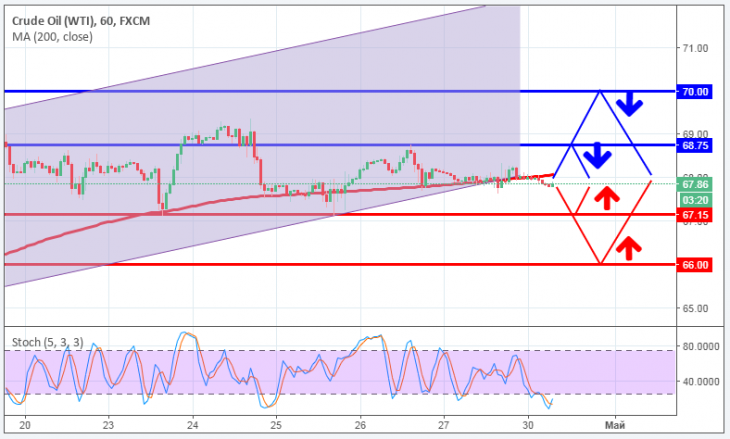
The WTI brand is trading below the zero mark during the Asian session.

  • Resistance 1: From $ 69.35 (April 24 maximum)
  • Resistance 2: From $ 68.75 (April 26 maximum)
  • Support 1: From $ 67.15 (technical level)
  • Support 2: From $ 66.00 (psychological level)

Computer analysis: The Stochastic Oscillator movings on the chart H1 indicate oversold of the instrument, in connection with which the increase in the price of WTI is possible.