Technical analys of gold and silver (Anton Hanzenko)
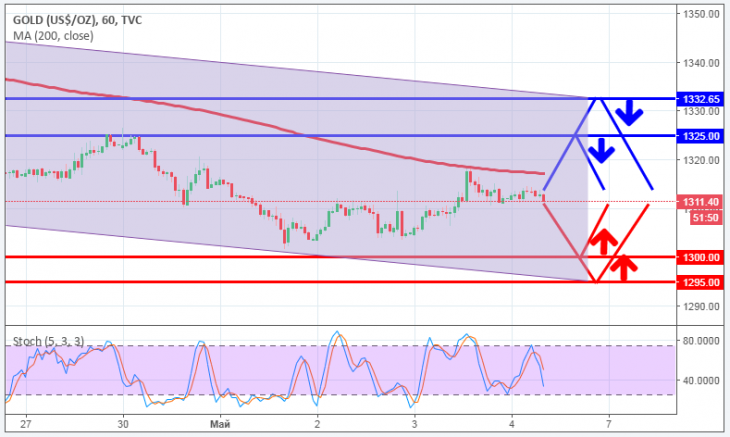
Gold chart (current price: $ 1312.40)
Gold was under the pressure of a growth of the American, but so far it maintains an upward trend.
Gold was under the pressure of a growth of the American, but so far it maintains an upward trend.
The oil of the main brands dropped significantly by the end of Monday, pending a decision on Iran’s nuclear deal, the results of which are expected today.
The Brent adjusted after updating the maximum.
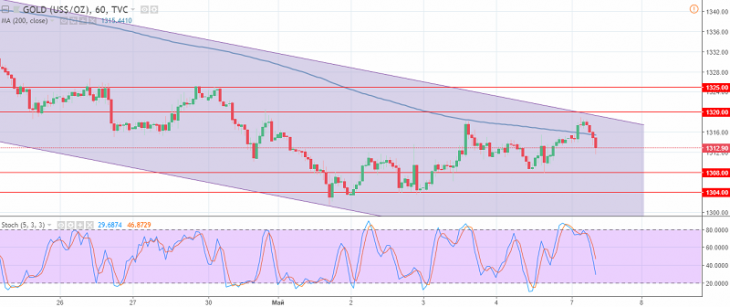
Gold updated a maximum of a month, but it turned out under pressure of correction at the Asian session.
Oil updated a maximum of three years on the waiting for the implementation of sanctions against Iran.
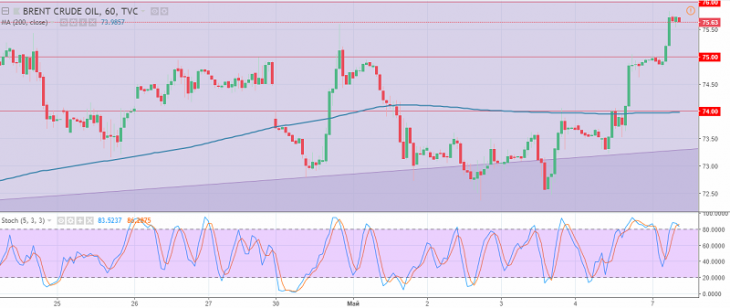
The Brent is trading near a three-year high.
Gold is trading near the zero mark during the Asian session.