技术分析

Technical analysis of cross-rates. (Anton Hanzenko)

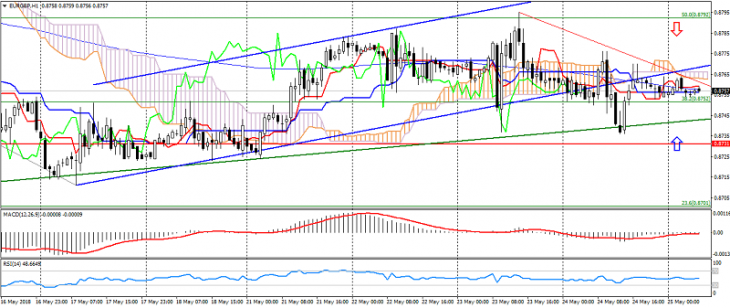
EUR GBP (current price: 0.8790)
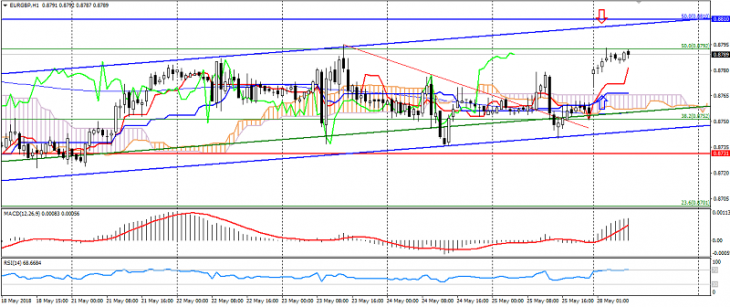
  • Support levels: 0.8730 (minimum of the last months), 0.8650, 0.8530.
  • Resistance levels: 0.8810, 0.8900, 0.9050 (November 2016 maximum).
  • Computer analysis: MACD (12, 26, 9) (signal – upward movement): the indicator is below 0, the signal line is in the body of the histogram. RSI (14) is in the overbought zone. Ichimoku Kinko Hyo (9, 26, 52) (signal – upward movement): the Tenkan-sen line is above the Kijun-sen line, the price is higher than the cloud.
Тechnical analysis of currency pairs (Anton Hanzenko)

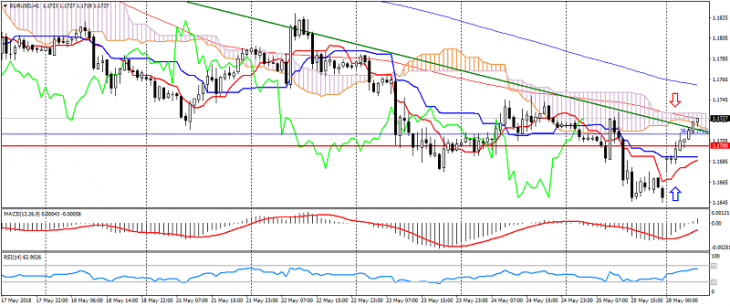
EUR USD (current price: 1.1720)

  • Support levels: 1.2100 (September 2017 maximum), 1.1900, 1.1700.
  • Resistance levels: 1.2600, 1.2750 (March 2013 minimum), 1.2270 (November 2014 minimum).
  • Computer analysis: MACD (12, 26, 9) (signal – upward movement): the indicator is below 0, the signal line has left the body of the histogram. RSI (14) is in easy overbought. Ichimoku Kinko Hyo (9, 26, 52) (signal-flat): the Tenkan-sen line is below the Kijun-sen line, the price is in the cloud.

Technical analysis of gold and silver (Andre Green)

Gold chart (current price: $ 1302.00)


Gold fell under the pressure of correction after rapid growth yesterday on the general flight from risks.

Technical analysis of oil (Dani Leviant)

Oil keeps a downward trend on concerns about increasing oil production in OPEC and the growth of crude oil reserves in the US.

Brent chart (current price: $ 78.50)


The Brent brand accelerated the decline and limited to $ 78.50 per barrel, while maintaining the potential for growth and a two-month uptrend.

Technical analysis of cross-rates. (Anton Hanzenko)

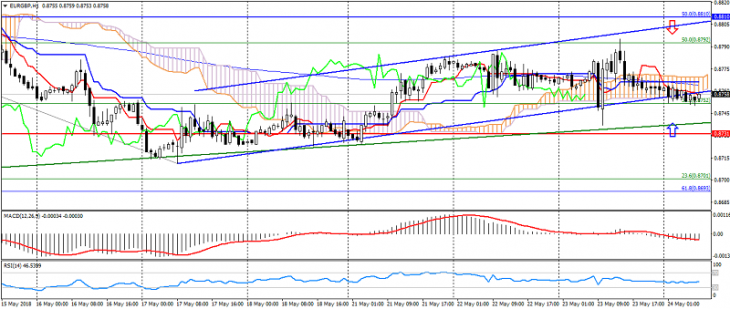
EUR GBP (current price: 0.8760)

  • Support levels: 0.8730 (minimum of the last months), 0.8650, 0.8530.
  • Resistance levels: 0.8810, 0.8900, 0.9050 (November 2016 maximum).
  • Computer analysis: MACD (12, 26, 9) (signal-flat): the indicator is near 0. RSI (14) is in the neutral zone. Ichimoku Kinko Hyo (9, 26, 52) (signal – downward movement): the Tenkan-sen line is below the Kijun-sen line, the price is below the cloud.

Тechnical analysis of currency pairs (Anton Hanzenko)

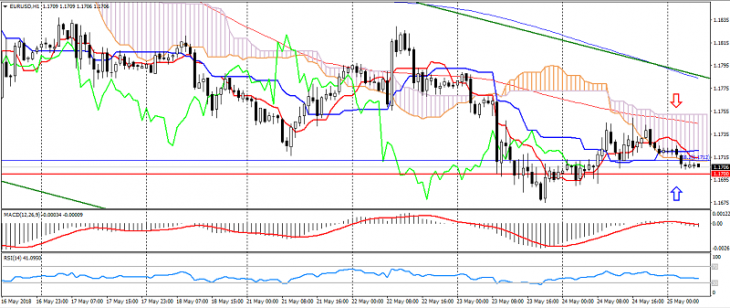
EUR USD (current price: 1.1710)

  • Support levels: 1.2100 (September 2017 maximum), 1.1900, 1.1700.
  • Resistance levels: 1.2600, 1.2750 (March 2013 minimum), 1.2270 (November 2014 minimum).
  • Computer analysis: MACD (12, 26, 9) (signal – downward movement): the indicator is below 0, the signal line is in the body of the histogram. RSI (14) is in the neutral zone. Ichimoku Kinko Hyo (9, 26, 52) (signal – downward movement): the Tenkan-sen line is below the Kijun-sen line, the price is below the cloud.

Technical analysis of gold and silver (Andre Green)

Gold chart (current price: $ 1296.00)


Gold remains in a sideways trend, receiving little support on growing fears.

Technical analysis of oil (Dani Leviant)

Oil is traded with a slight decrease from the opening of the day, remaining under pressure on the growth of oil reserves in the US.

Brent chart (current price: $ 79.40)


The Brent is limited to a mark of $ 80 per barrel, while retaining the potential for growth.

Technical analysis of cross-rates. (Anton Hanzenko)

EUR GBP (current price: 0.8760)

  • Support levels: 0.8730 (minimum of the last months), 0.8650, 0.8530.
  • Resistance levels: 0.8810, 0.8900, 0.9050 (November 2016 maximum).
  • Computer analysis: MACD (12, 26, 9) (signal – downward movement): the indicator is below 0, the signal line is in the body of the histogram. RSI (14) is in the neutral zone. Ichimoku Kinko Hyo (9, 26, 52) (signal – downward movement): the Tenkan-sen line is below the Kijun-sen line, the price is below the cloud.