技术分析

Technical analysis of cross-rates. (Anton Hanzenko)

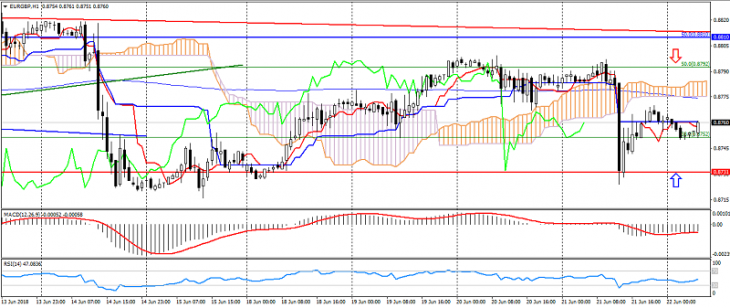
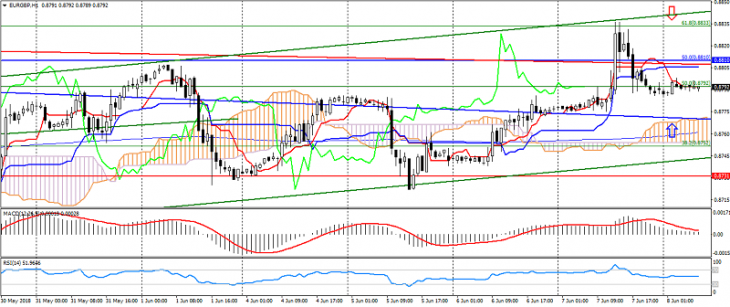
EUR GBP (current price: 0.8780)

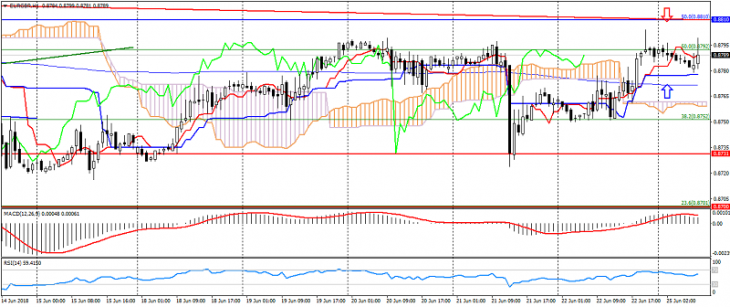
  • Support levels: 0.8730 (minimum of the last months), 0.8700, 0.8620 (minimum of April).
  • Resistance levels: 0.8810, 0.8850, 0.8900.
  • Computer analysis: MACD (12, 26, 9) (signal – downward movement): the indicator is higher than 0, the signal line has left the body of the histogram. RSI (14) in the neutral zone. Ichimoku Kinko Hyo (9, 26, 52) (signal – upward movement): the Tenkan-sen line above the Kijun-sen line, the price is higher than the cloud.

Тechnical analysis of currency pairs (Anton Hanzenko)

EUR USD (current price: 1.1640)

  • Support levels: 1.1600, 1.1500 (local minimum), 1.1450.
  • Resistance levels: 1.1750, 1.1850 (June maximum), 1.1900 (significant psychology).
  • Computer analysis: MACD (12, 26, 9) (signal – downward movement): the indicator is higher than 0, the signal line has left the body of the histogram. RSI (14) in the neutral zone. Ichimoku Kinko Hyo (9, 26, 52) (signal – upward movement): the Tenkan-sen line above the Kijun-sen line, the price is higher than the cloud.

Technical analysis of oil (Dani Leviant)

The main oil brands are traded with a slight strengthening at the beginning of the day, pending the publication of the results of the OPEC meeting. At the same time, the oil market is very nervous because of the expectation of data on quotas for oil production.

The Brent brand chart (current price: $ 73.90)

Brand Brent is traded low after rising at the beginning of the day waiting for OPEC statements.

Technical analysis of cross-rates. (Anton Hanzenko)

EUR GBP (current price: 0.8760)

  • Computer analysis: MACD (12, 26, 9) (signal – downward movement): the indicator is below 0, the signal line in the body of the histogram. RSI (14) in the neutral zone. Ichimoku Kinko Hyo (9, 26, 52) (signal – downward movement): the Tenkan-sen line is below the Kijun-sen line, the price is below the cloud.

Тechnical analysis of currency pairs (Anton Hanzenko)

EUR USD (current price: 1.1610)

  • Computer analysis: MACD (12, 26, 9) (signal – upward movement): indicator above 0, signal line in the body of the histogram. RSI (14) in the neutral zone. Ichimoku Kinko Hyo (9, 26, 52) (signal – upward movement): the Tenkan-sen line above the Kijun-sen line, the price is higher than the cloud.

Technical analysis of gold and silver (Andre Green)

Gold Chart (current price: $ 1296.00)


Gold is traded with a slight decrease, despite the growth of risks, but is limited in reducing the lower boundary of the upward channel.

Technical analysis of oil (Dani Leviant)

The main oil brands at the Friday traiding were under pressure of correction after the rise and expectation of  data on drilling activity in the US.

The Brent brand graph (current price: $ 76.90)


Brand Brent is trading with a decrease at the start of the day on the correction and growth of negative sentiment, limiting the downtrend channel.

Technical analysis of cross-rates. (Anton Hanzenko)

EUR GBP (current price: 0.8790)

  • Support levels: 0.8730 (minimum of the last months), 0.8650, 0.8530.
  • Resistance levels: 0.8810, 0.8900, 0.9050 (November 2016 high).
  • Computer analysis: MACD (12, 26, 9) (signal – downward movement): the indicator is higher than 0, the signal line has left the body of the histogram. RSI (14) in the neutral zone. Ichimoku Kinko Hyo (9, 26, 52) (signal – upward movement): the Tenkan-sen line is below the Kijun-sen line, the price is higher than the cloud.