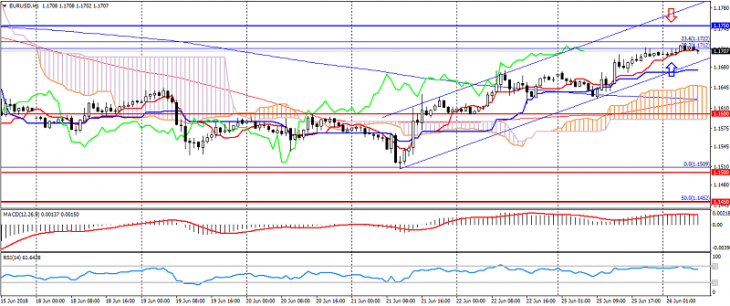
EUR USD (current price: 1.1640)
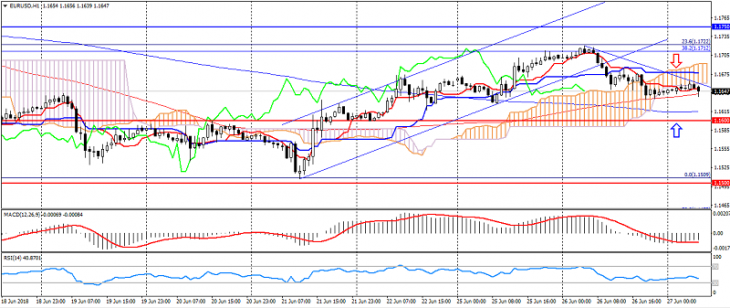
- Support levels: 1.1600, 1.1500 (local minimum), 1.1450.
- Resistance levels: 1.1750, 1.1850 (June maximum), 1.1900 (significant psychology).
- Computer analysis: MACD (12, 26, 9) (signal – upward movement): the indicator is below 0, the signal line has left the body of the histogram. RSI (14) in the zone of easy overselling. Ichimoku Kinko Hyo (9, 26, 52) (flat signal): the Tenkan-sen line below the Kijun-sen line, the price is in the cloud.
- The main recommendation: sale entry is from 1.1680, 1.1700, 1.1730.
- Alternative recommendation: buy entry is from 1.1620, 1.1600, 1.1580.
The euro-dollar pair went into a correction phase on strengthening the American dollar, but is limited to 1.1600 support.
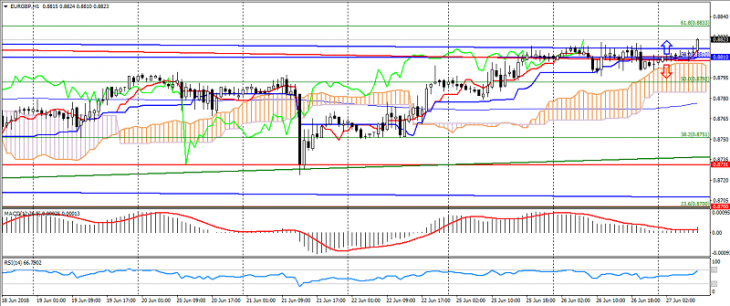
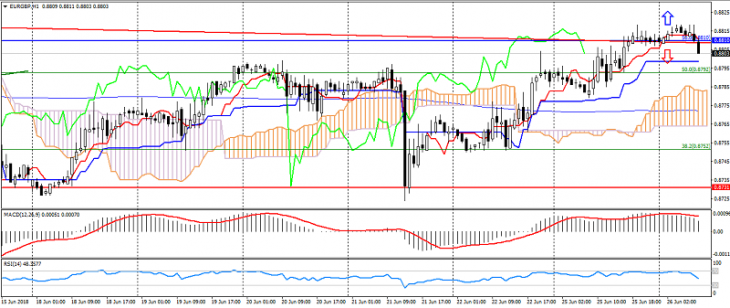
GBP USD (current price: 1.3220)
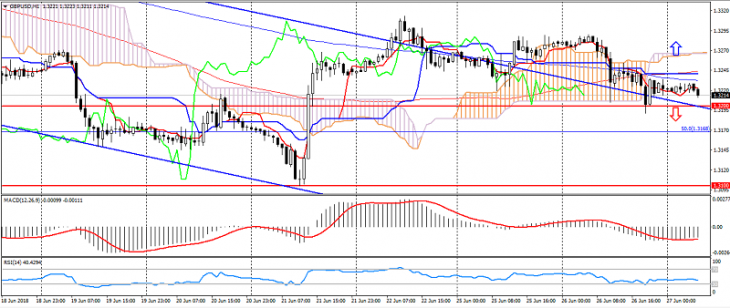
- Support levels: 1.3200, 1.3100 (the minimum of the current year), 1.3050 (November 2017 low).
- Resistance levels: 1.3350, 1.3360 (June maximum), 1.3600.
- Computer analysis: MACD (12, 26, 9) (signal – upward movement): the indicator is below 0, the signal line has left the body of the histogram. RSI (14) in the neutral zone. Ichimoku Kinko Hyo (9, 26, 52) (signal – downward movement): the Tenkan-sen line is below the Kijun-sen line, the price is below the cloud.
- The main recommendation: sale entry is from 1.3250, 1.3270, 1.3300.
- Alternative recommendation: buy entry is from 1.3200, 1.3170, 1.3150.
The British pound remains under pressure on attempts to return to a downward trend.
USD CHF (current price: 0.9920)
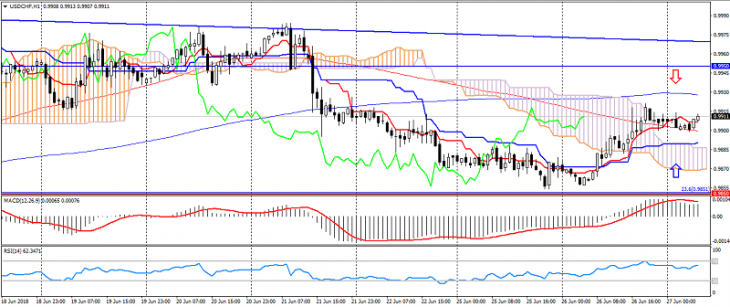
- Support levels: 0.9850, 0.9780 (June low), 0.9700.
- Resistance levels are: 0.9950, 1.0030 (May maximum), 1.0150.
- Computer analysis: MACD (12, 26, 9) (signal – downward movement): the indicator is above 0, the signal line has left the body of the histogram. RSI (14) in the neutral zone. Ichimoku Kinko Hyo (9, 26, 52) (signal – upward movement): the Tenkan-sen line above the Kijun-sen line, the price is higher than the cloud.
- The main recommendation: sale entry is from 0.9930, 0.9950, 0.9970.
- Alternative recommendation: buy entry is from 0.9880, 0.9850, 0.9830.
The US dollar the Swiss franc, also strengthened on the growth of the dollar, but is limited by a general downward trend.
USD JPY (current price: 109.90)
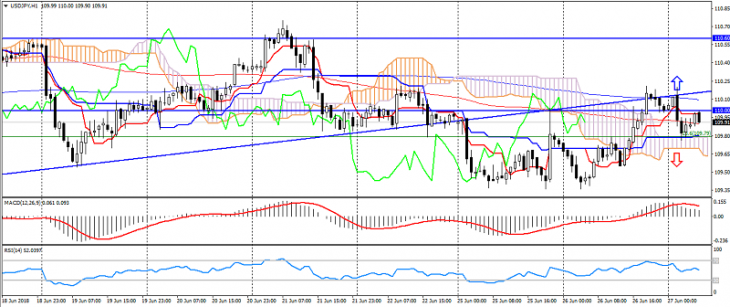
- Support levels: 109.00, 108.00 (minimum of May), 107.50.
- Resistance levels: 110.00, 110.60, 111.40 (May maximum).
- Computer analysis: MACD (12, 26, 9) (signal – downward movement): the indicator is above 0, the signal line has left the body of the histogram. RSI (14) in the neutral zone. Ichimoku Kinko Hyo (9, 26, 52) (signal – upward movement): the Tenkan-sen line above the Kijun-sen line, the price is higher than the cloud.
- The main recommendation: sale entry is from 110.00, 110.30 110.50.
- Alternative recommendation: buy entry is from 109.60, 109.30, 109.00.
The US dollar the Japanese yen isfalling despite the overall growth of the American dollar, which is connected with the preservation of risks.
USD CAD (current price: 1.3320)
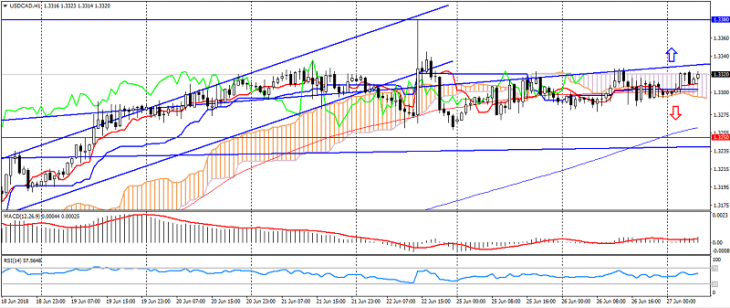
- Support levels: 1.3250, 1.3150, 1.3050 (May high).
- Resistance levels: 1.3380, 1.3450 (June maximum), 1.3540.
- Computer analysis: MACD (12, 26, 9) (signal – upward movement): indicator above 0, signal line in the body of the histogram. RSI (14) in the neutral zone. Ichimoku Kinko Hyo (9, 26, 52) (flat signal): the Tenkan-sen line above the Kijun-sen line, the price is in the cloud.
- The main recommendation: sale entry is from 1.3340, 1.3360, 1.3380.
- Alternative recommendation: buy entry is from 1.3300, 1.3250, 1.3220.
A pair of US dollar the Canadian dollar moves near the upper border of the upward channel on the strengthening of the American dollar.
AUD USD (current price: 0.7370)
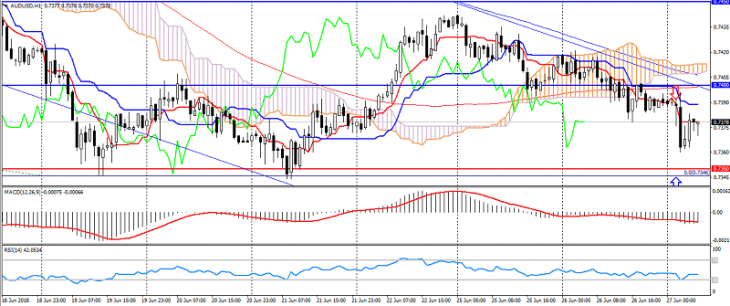
- Support levels: 0.7350, 0.7320, 0.7250.
- Resistance levels: 0.7400, 0.7450, 0.7500.
- Computer analysis: MACD (12, 26, 9) (signal – downward movement): the indicator is below 0, the signal line in the body of the histogram. RSI (14) in the neutral zone. Ichimoku Kinko Hyo (9, 26, 52) (signal – downward movement): the Tenkan-sen line is below the Kijun-sen line, the price is below the cloud.
- The main recommendation: sale entry is from 0.7400, 0.7420, 0.7450.
- Alternative recommendation: buy entry is from 0.7350, 0.7330, 0.7300.
The Australian dollar accelerated the decline on the collapse of the Chinese yuan.
NZD USD (current price: 0.6820)
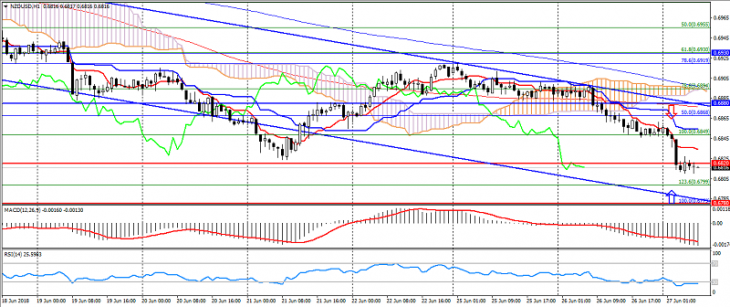
- Support levels: 0.6820, 0.6780, 0.6750.
- Resistance levels: 0.6880, 0.6930, 0.7000.
- Computer analysis: MACD (12, 26, 9) (signal – downward movement): the indicator is below 0, the signal line in the body of the histogram. RSI (14) in the oversold zone. Ichimoku Kinko Hyo (9, 26, 52) (signal – downward movement): the Tenkan-sen line below the Kijun-sen line, the price is in the cloud.
- The main recommendation: sale entry is from 0.6840, 0.6960, 0.6880.
- Alternative recommendation: buy entry is from 0.6820, 0.6800, 0.6780.
The New Zealand dollar also traded with a decrease in the growth of risks in the region.
XAU USD (current price: 1255.00)
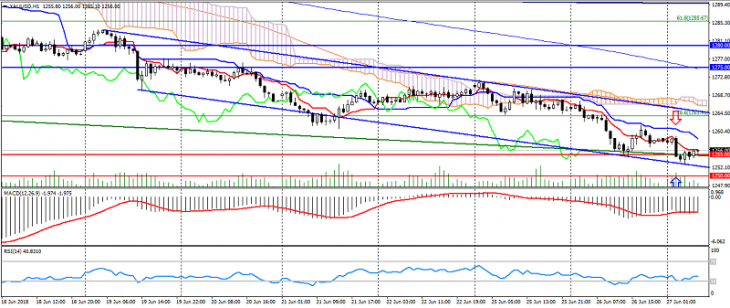
- Support levels: 1255.00, 1250.00, 1235.00.
- Levels of resistance: 1275.00, 1290.00, 1290.00.
- Computer analysis: MACD (12, 26, 9) (signal – downward movement): the indicator is below 0, the signal line in the body of the histogram. RSI (14) in the neutral zone. Ichimoku Kinko Hyo (9, 26, 52) (signal – downward movement): the Tenkan-sen line is below the Kijun-sen line, the price is below the cloud.
- The main recommendation: sale entry is from 1260.00, 1264.00, 1265.00.
- Alternative recommendation: buy entry is from 1252.00, 1250.00, 1246.00.
Gold remains under pressure, limited to oversold and bullish divergence.