
Technical analysis of gold and silver (Alexander Sivtsov)
Gold chart (current price: $ 1327.03)
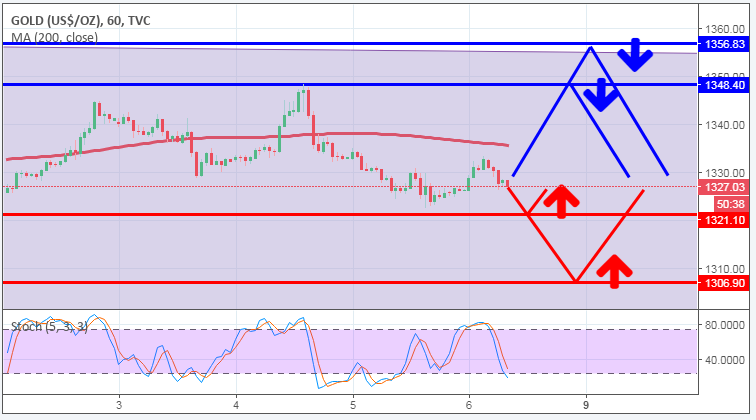
Gold is traded near the zero mark during the Asian session.
- Resistance 1: From $ 1348.40 (April 4 maximum)
- Resistance 2: From $ 1356.83 (March 27 maximum)
- Support 1: From $ 1321.10 (March 29 minimum)
- Support 2: From $ 1306.90 (March 20 minimum)
Computer analysis: The Stochastic Oscillator movings on the chart of H1 indicate the oversold of the instrument, against which the recovery of the price of gold is possible.
Silver chart (current price: $ 16,330)

Silver is traded just below the zero mark during the Asian session.
- Resistance 1: From $ 16.529 (April 4 maximum)
- Resistance 2: From $ 16.675 (April 2 maximum)
- Support 1: From $ 16.20 (March 29 minimum)
- Support 2: From $ 16.09 (March 20 minimum)
Computer analysis: The Stochastic Oscillator movings on the chart of H1 indicate the oversold of the instrument, against which the resumption of growth in the price of silver is possible.