
Technical Analysis of Oil (Alexander Sivtsov)
Oil is declining during the Asian session.
The Brent graph (current price: $ 6867.70 per 100 barrels)
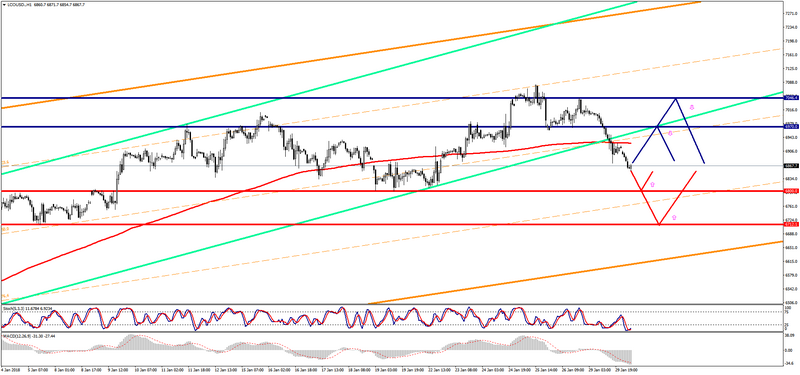
The Brent brand is traded with a minus during the Asian session.
- Resistance 1: From $ 6970.00 (support line of the pierced Up channel on H1)
- Resistance 2: From $ 7046.40 (January 26 maximum)
- Support 1: From $ 6800.00 (psychological level)
- Support 2: From $ 6712.10 (January 5 minimum)
Computer analysis: The Stochastic Oscillator movings on the charts of H1 and H4 indicate the oversold of the instrument. The recovery of the price of Brent is possible.
The WTI graph (current price: $ 6479.90 per 100 barrels)
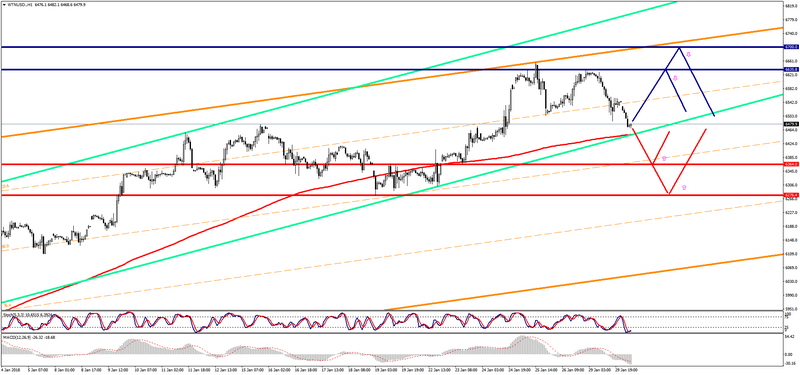
The WTI brand is traded below the zero mark during the Asian session.
- Resistance 1: From $ 6635.80 (January 26 maximum)
- Resistance 2: From $ 6700.00 (psychological level)
- Support 1: From $ 6364.00 (technical level)
- Support 2: From $ 6276.40 (January 19 minimum)
Computer analysis: The Stochastic Oscillator movings on the charts of H1 and H4 indicate the oversold of the instrument, the increase in the price of WTI is expected.